Testing Water &
Soil
Experiment #9: Tap Water Testing
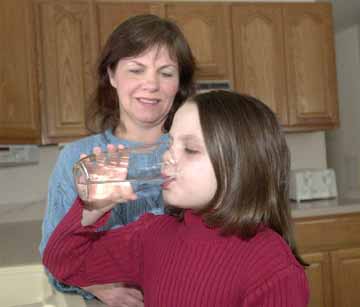
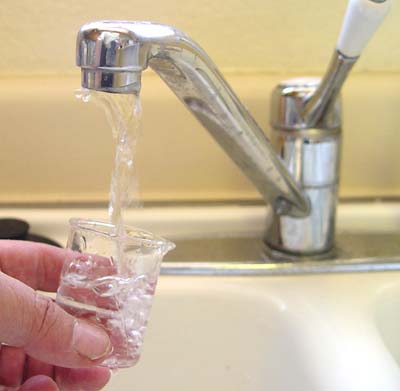
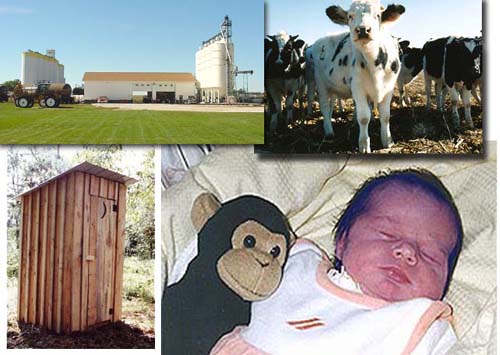
The water we use at home is probably one of the most important safety concerns we face. It's unfortunate, that polluted water can look the same as pure water. Cloudy or muddy water may just contain harmless sediment. (This image is from an article that talked about high levels of arsenic in a town's drinking water)
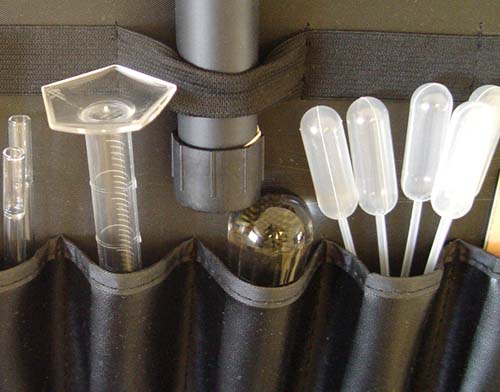
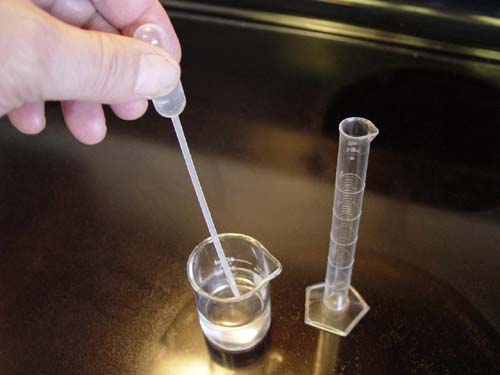
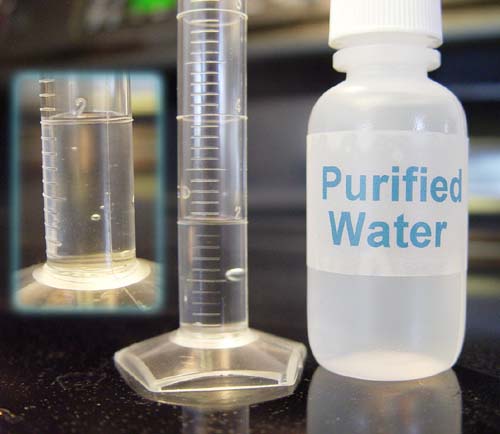
#1 &2: You will be using the plastic pipettes and the 10 milliliter graduated cylinder. These are in the pockets in the lid of your kit.
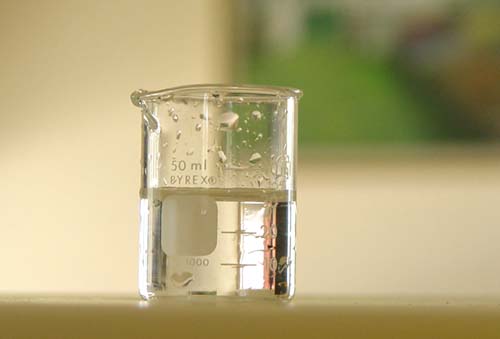
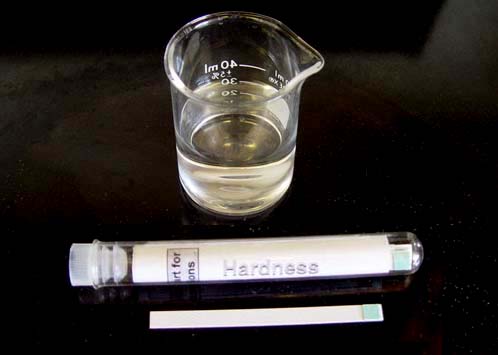
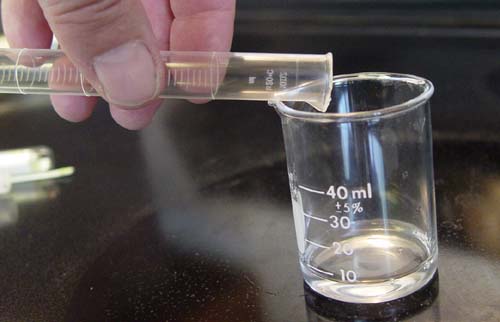
#3. You will be using the small 50 mL beaker for holding the tap water.


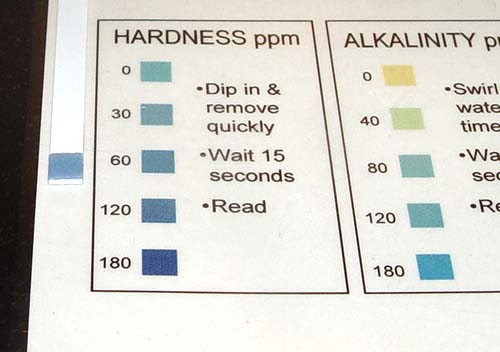
#5: You will be using the Color Chart for Test Papers and Test Strips.
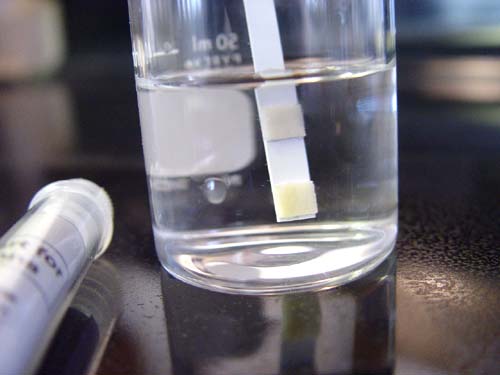
Fill the small 50mL beaker to about 40 mL.
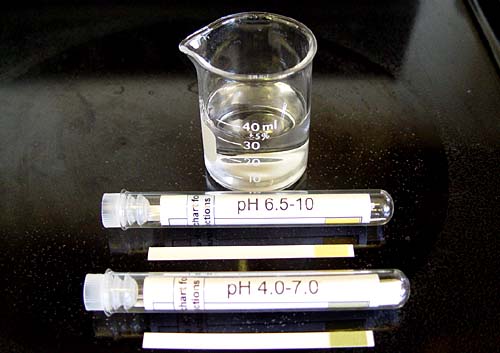

Let's say we start off with the pH 6.5-10 paper. (If you happen to not have pH 6.5-10, use pH 1 to 14.) Dip the paper into the beaker with the tap water for just a couple of seconds. Then take it to the chart.

For my water, it looks like the pH is between 6.8 and 7.1. So it's looks pretty much neutral. We can now try the other test paper (pH 4.0-7.0) for confirmation.

This is the pH paper for the 4.0-7.0 range. Dip in the tap water for a couple of seconds and take it to the chart.


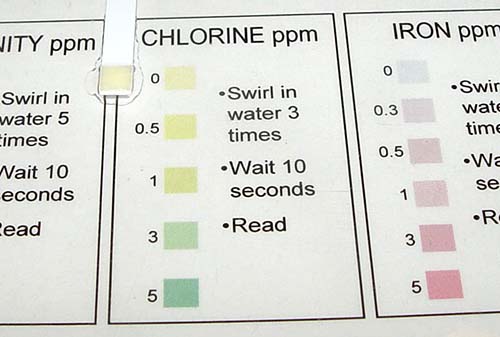
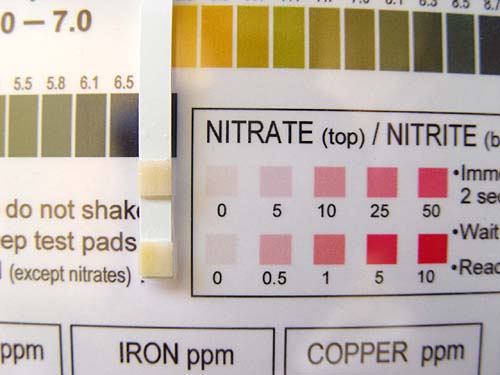
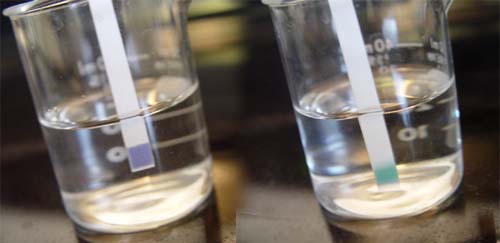
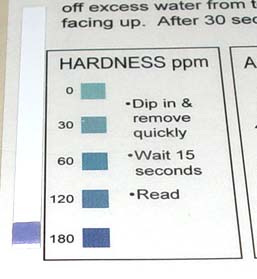
Take the hardness test paper and dip in tap water. Remove immediately and wait 15 seconds to read the value on the chart.
Note: The alkalinity test strips don't store well and I discontinued using them. They also measure about the same as what the Hardness strips measure, so they are somewhat redundant.
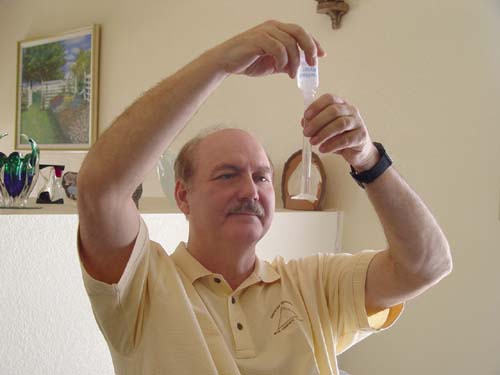
 (Take a picture
of yourself at this point in the lab.)
(Take a picture
of yourself at this point in the lab.)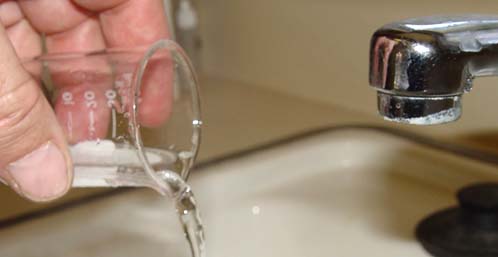


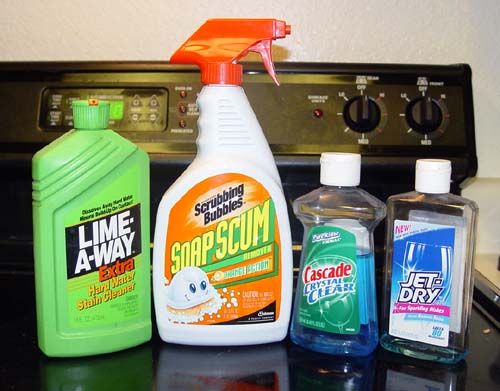
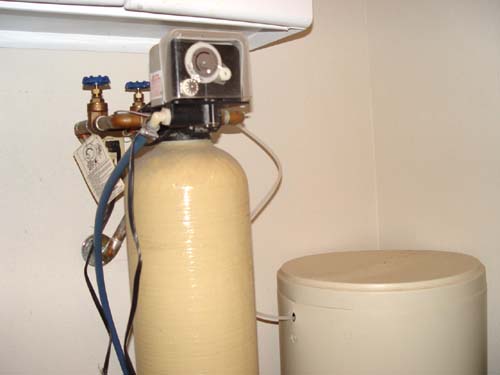
A water softener helps, but as a later experiment shows, you still have the same amount of dissolved salts. The calcium gets replaced by sodium, which works better with soaps and doesn't form scale that is hard to wash away. The sodium, however, is not that healthy to drink.

River, lake, and stream testing.
Pure water has nothing dissolved in it. So pure water has zero total dissolved solids. However, when minerals, salts, and pollutants dissolve in water, then the total amount of these dissolved solids gives an indication of the water's quality. The Environmental Protection Agency, for example, would measure total dissolved solids (TDS) in lakes, rivers, and streams to monitor water quality.
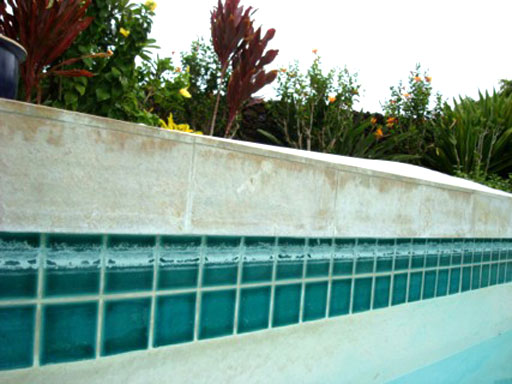
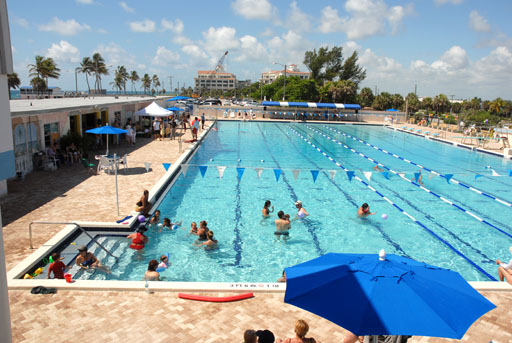
Swimming pool and spa maintenance.
High TDS indicates hard water, meaning there are a lot of dissolved minerals that will form scale (white crusty mineral deposits made mostly of calcium carbonate) on the sides of the swimming pool or spa and the insides of pipes. Monitoring TDS can allow intervention before scale forms.
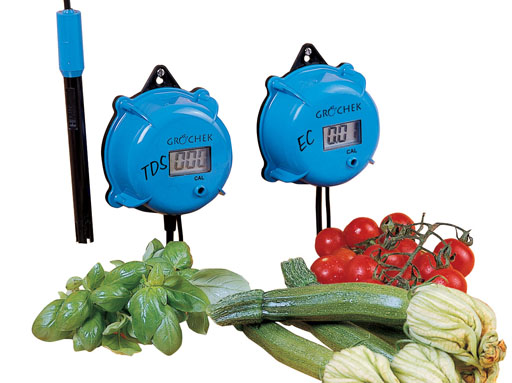
Agriculture and hydroponics (hydroponics is the science of growing plants without soil).
Moisture in soil that has high salt levels will not move into the plants' roots, causing drought symptoms even when there is plenty of water present. A TDS meter can see if the water for the plants is too salty.
Using a meter that measures TDS is also useful in keeping track of the level of nutrients in the water. Most of the nutrients for plants increase the TDS levels (more nutrients are dissolved). So in these cases, a high TDS level indicates plenty of nutrients are present. This meter can also check the quality of water that is being brought in to water the plants. In looking at water coming in, high TDS might indicate too many minerals (hard water). So the grower may want to lower the TDS by removing the excess minerals before adding nutrients.
The TDS meter is on the left. An electrical conductivity (EC) meter is on the right. The EC meter is basically measuring the same thing but reports values using different units of measurement.

Aquarium maintenance
TDS (total dissolved solids) is a measurement that can help track the levels of dissolved waste and dissolved minerals. When TDS levels are too high, the aquarium water is pumped through various filters to remove the dissolved waste and dissolved minerals. These filters are often reverse osmosis membranes that allow water to pass but little of anything else.
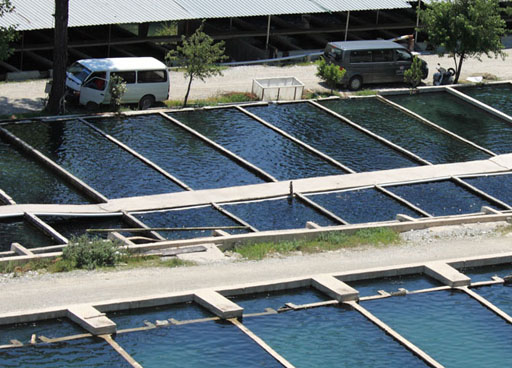
Aquaculture
Aquaculture is the farming of fish, oysters, or seaweed in controlled environments.
TDS levels are monitored because high levels of TDS can kill young fish.
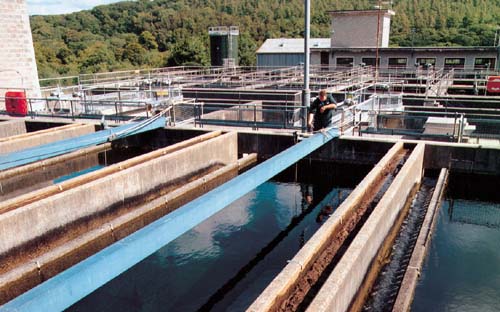
![reverse osmosis plant]](reverseOsmosis2.jpg)
Water treatment plants and home water use
Water that has high TDS values will taste salty, metallic, or bitter. The Environmental Protection Agency (EPA) sets the maximum level of total dissolved solids for drinking water to be 500 milligrams (half a gram) of dissolved solids for every liter of water.
These dissolved solids are removed using reverse osmosis membranes. As mentioned earlier these membranes allow water to pass through but block large atoms, larger compounds, and microscopic particles that make up dissolved solids. These membranes also block toxic metals and other toxic substances.
Reverse osmosis systems are used in the home, water plants, and at places that dispense drinking water (usually at 25 cents a gallon)
Source and make up of dissolved solids
Rain water has no dissolved solids. So it has zero TDS. However, when it contacts the ground, the rain will dissolve fertilizers, salts and minerals, animal waste, pesticides, plus other chemicals that may be on the ground from cars and industrial pollution. Even decaying plants have chemicals that get dissolved. Water can also pickup more solids as it passes through copper pipes. So these dissolved solids can be a multitude of chemicals.
The most common chemicals counted in TDS tests are salts like sodium chloride (table salt), calcium chloride (salt placed on icy roads) and fertilizers like ammonium nitrate, various phosphates, and various potassium salts (potassium carbonate, potassium chloride, potassium sulfate). There are also dissolved minerals like calcium carbonate (limestone) or magnesium carbonate and calcium sulfate (gypsum/drywall material) or magnesium sulfate (Epsom salts).
There are thousands of other chemicals in our water, but TDS looks at all of them as one group (one reading).
TDS meters are popular because they are easy to use. There's just a few things to keep in mind in order to get accurate readings.
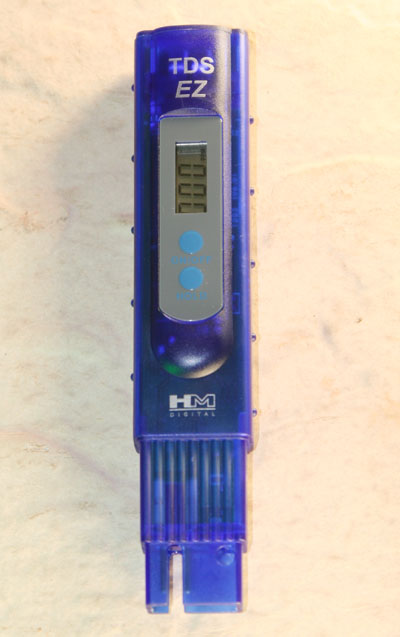
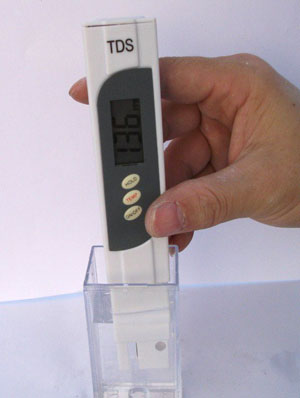
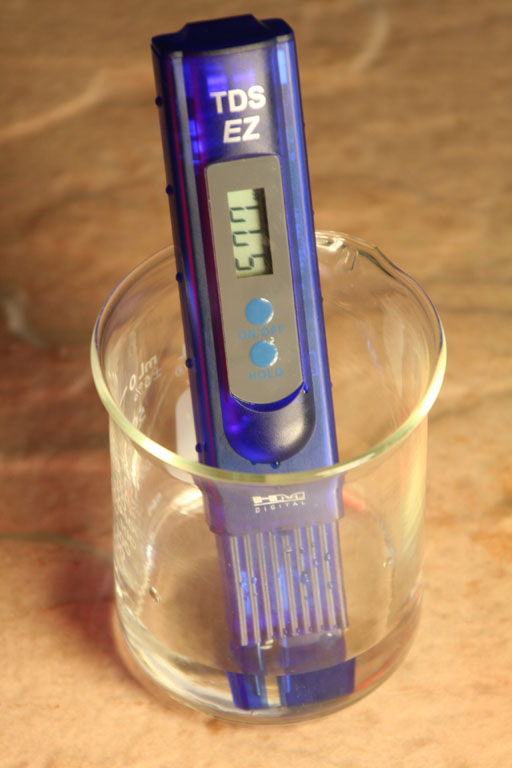
This is the TDS meter which is in your kit. The readout screen shows TDS in parts per million (meaning grams of dissolved solids in a million grams of water). Note, that the same numbers can also be read as milligrams per liter.
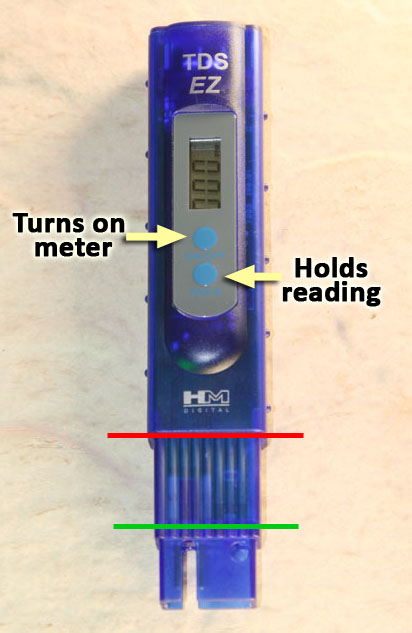
The top blue button turns on the meter. Use the same button to turn it off. If left on too long, the meter will turn itself off.
The bottom blue button freezes the readout so that you can remove the meter from the water and the readout doesn't change.
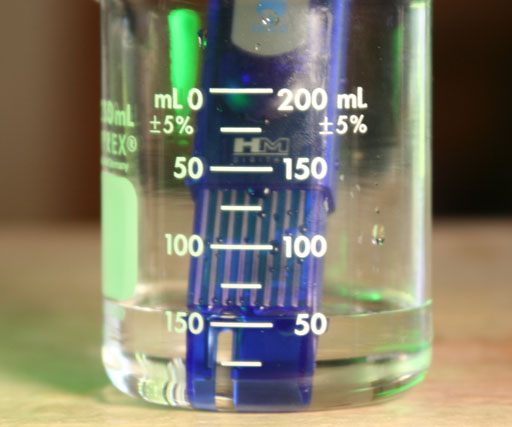
The meter needs to be submerged between the green line and the red line. Do NOT submerge the meter any lower in the water than where the red line is. The TDS meter is not water-proof.
The solution needs to cover the metal posts that measure the conductivity. If the meter is dipped to the green line, then the metal posts are covered.
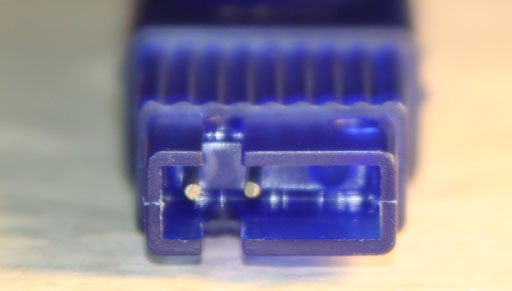
To take a reading, simply dip the probes into the water being measured. Stir meter gently so that any bubbles clinging to the metal posts are dislodged. If you can see the screen, then you can get the reading for Total Dissolved Solids. If it's hard to see the screen, press the lower blue button once to freeze the reading on the screen, then bring the meter up close to you to read the screen.
The first thing to test is your tap water.
Fill the larger beaker (250mL beaker) between 50 and 100 mL with tap water from the cold water side.
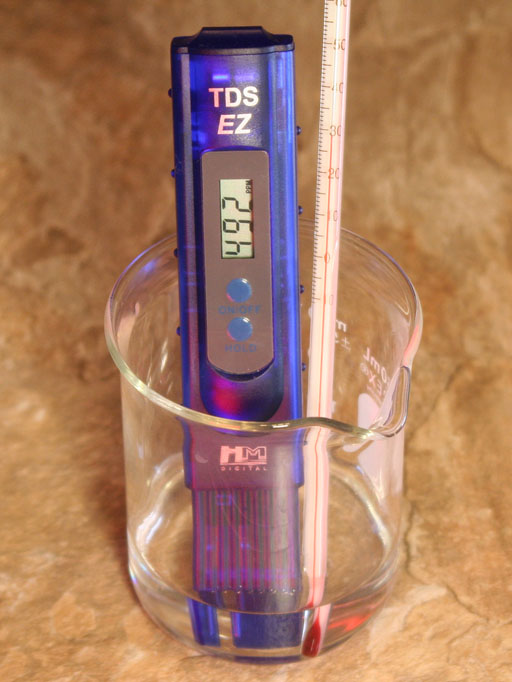
Place the TDS meter into the beaker, and place the thermometer from the kit along side the TDS meter. Turn on the TDS meter (top blue button) and record the TDS reading. Now record the temperature.
The TDS meter is calibrated to be accurate at 25°C or 77°F. If your tap water is different from 77°F, then there needs to be an adjustment for the different temperature. In this example, the reading was 492 mg/L. The temperature was 86°F (30°C). That is over 77°F, so we need to compensate for the temperature difference by subtracting the adjustment value. The temperature difference is 86°F-77°F, which is 9°F. Multiply that by 0.01 to get 0.09. Multiply 0.09 times 492 mg/L to find the adjustment value of 44.28. Since 86°F is over 77°F, we subtract the adjustment value (492-44.28) to get 448 mg/L.
Compensation x temp difference x reading = adjustment value
0.01 x 9°F x 492 mg/L= 44.28 to be subtracted from 492
1 °F
492 mg/L - 44.28 = 447.71 mg/L which is rounded to 448 mg/L as corrected TDS value.
Remember, if your temperature is below 77°F, then you would add the adjustment value.
Report the TDS value that you read off of your meter.
Report the temperature of your water.
Report the TDS value corrected for the temperature of your tap water.
Compare the corrected reading you calculated with the readings in the below chart. What category does your tap water fall into?
|
|
|
|
|
|
|
|
|
|
|
|
|
|
|
|
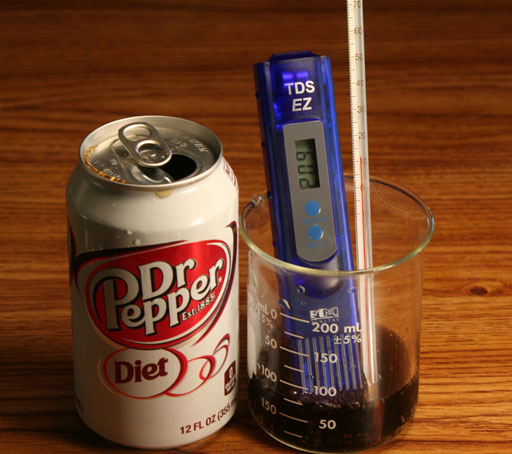
Now check the TDS level of a beverage like a soda, juice, tea, coffee, or beer. Warning: If you choose a carbonated beverage, you will probably notice the readings jumping up and down. What do you think would cause that?
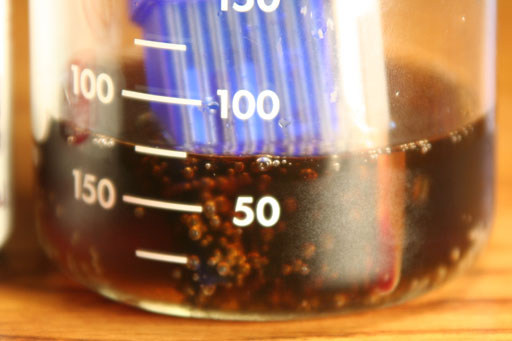
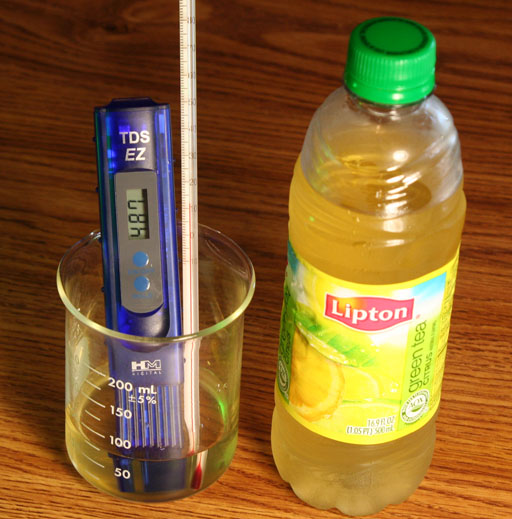
Rinse out the 250 mL beaker and fill it between 50 mL and 100 mL with a beverage of your choice. Put the thermometer in the beaker too. Record the temperature and the TDS value, which is in mg/L (ppm). To get the reading corrected for temperature, do the same calculations mentioned above and also report the TDS value corrected for temperature.
If your beverage was cold, you will notice the TDS values going up as the liquid temperature goes up. That doesn't mean the TDS values are changing because the dissolved solids in the beverage are not changing. It just means the warmer TDS values will have less adjustment for temperature.
To be accurate, record the temperature and the TDS values close to the same time.
In this example, the TDS value is 487. The temperature was 52°F (11°C). This is below the 77°F standard temperature, so we need to add an adjustment value. First find the difference in degrees. 77°F- 52°F= 25°F
Multiply 25°F x 0.01 to get 0.25. Then multiply 0.25 x 487 mg/L to get 121.75. Since our liquid is colder, we need to add this adjustment value of 121.75. So 121.75 + 487 equals 608.75 mg/L, which is rounded to 609 mg/L. So that's the true TDS value which has be found by compensating for the temperature difference. Your TDS values and temperatures will be different, but this shows how the math is done.
What was the TDS value on your meter? What was the temperature of the beverage? What is the true TDS value after corrected for the temperature difference?