Experiment 1: Using a Spectroscope to analyze light |
|
|
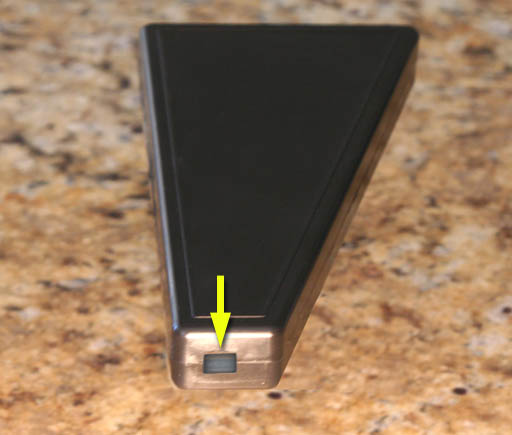
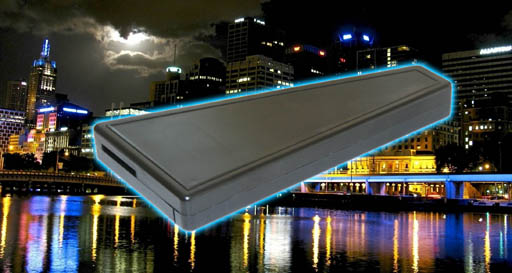
Spectroscope
The spectroscope in the picture is the one from your lab drawer. |
|
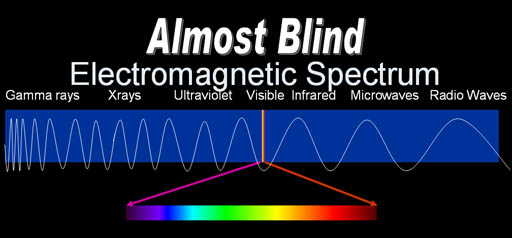
The entire light spectrum (also known as the electromagnetic spectrum) span light waves that are miles long to waves that are extremely short. The light we see (visible light) only spans about 1.5% of then entire light spectrum. So we would be legally blind considering what we could see. |
 |
Let’s say this image is made up of the whole electromagnetic spectrum. Roll the cursor over the image to see how much of the whole spectrum we actually see.
Yes, this is how blind we are. We are only picking up about 1.5 percent of the picture that we could see if we could see the whole electromagnetic spectrum. |
|
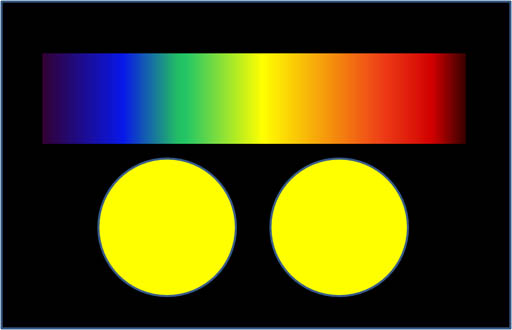
Even if we focus just on the visible light that we can see, we still have some weaknesses in our vision. In a rainbow we see pure colors. However, our eyes can't see the difference between a pure color that has a specific wavelength (yellow is about 570 nanometers) or a combination of red and green colors. So the left circle could be a pure yellow light, but the right circle could be small dots of red and green light that our brains interpret as yellow. |
|
|
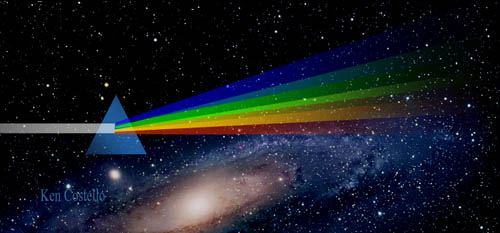
Over 300 years ago Newton experimented with a prism and
realized that white light was actually all colors combined. It revealed
a weakness in our human eyes. We can see millions of colors, but we can't
tell if a color is made from one color or mixtures of colors. |
|
|
A spectroscope is similar to a prism in that it can break up light into its component.
At one end of the spectroscope is a square film of material
that acts like a prism. The film is called a diffraction grating. It is
made by putting thousands of grooves on a plastic film. This bends the
light coming through it and, in essence, causes the light to spread out
into its different wavelengths of light (colors). This is the end
of the spectroscope you look through.
Look through this end now and aim the wide end at the white block below. Hold the end about 6 inches from the screen. |
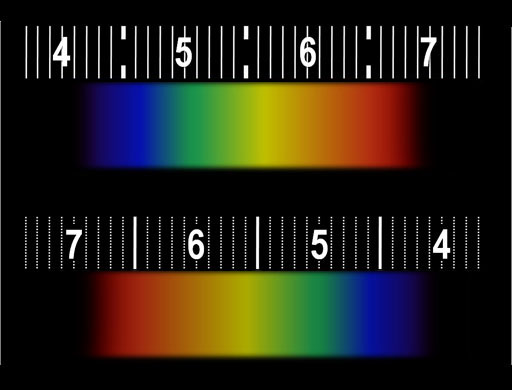
Look at this block of white with spectroscope. You may have to flip it over to see the numbers correctly.
|
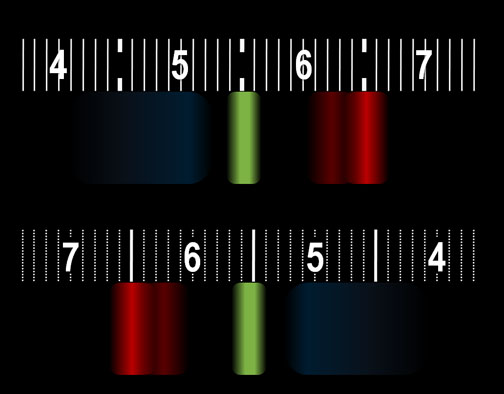
|
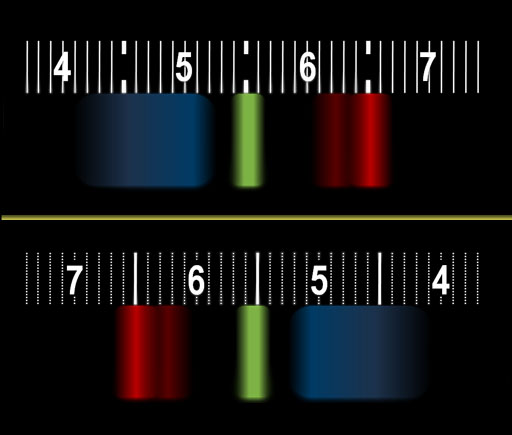
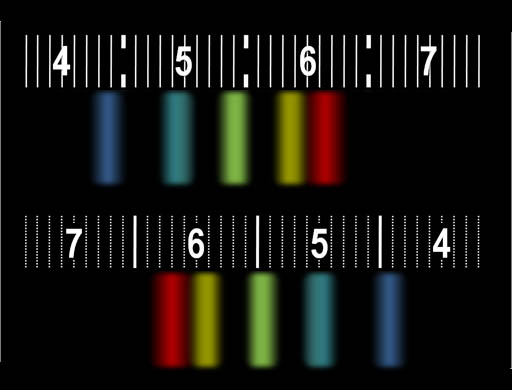
The spectroscope in your kit could be one of two brands. One has a scale like the top image and the other brand has a scale like the bottom image (They're reversed). This the what I see when viewing the white block above on my LCD using the spectroscope. The colors that TVs and computer monitors use to produce millions of colors are simply a combination of red, green, and blue. The numbers you see are the wavelengths of the light measured in hundred nanometers. (If you don't see the numbers, you may need to wear reading glasses.) The bright red band has a wavelength of 650 nanometers. The green band is about 550 nanometers. The wide blue band ranges from 450 nanometers (nm) and 520 nm. The spectrum from your monitor might look different but you should see red, green, and blue bands. |
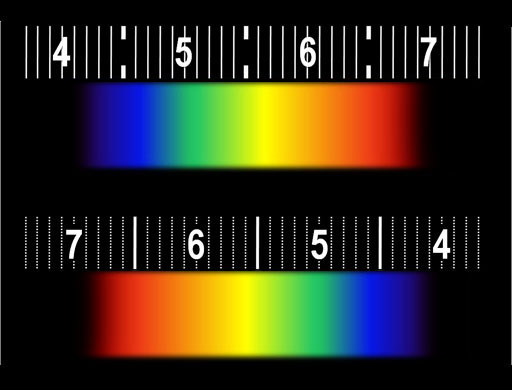
| Remember, our eyes can be fooled into seeing yellow by seeing a combination of red and green lights that are very close to each other. Your computer monitor has small pixels of green and red to make us see yellow. Look at the yellow block below with the spectroscope. You
should be about 6 inches from the computer screen. |
|
 |
Here we see that the yellow color above is not a pure yellow. It's a mix of green and red. Green is just below yellow and ranges from about 500 to 560. TVs and Computer monitors make us see yellow by lighting up red and green phosphors (pixels). You might see a little bit of blue in your spectrum, but it's not normally there or needed for bright yellow. |
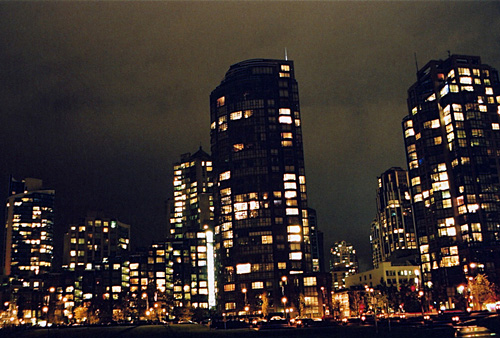 |
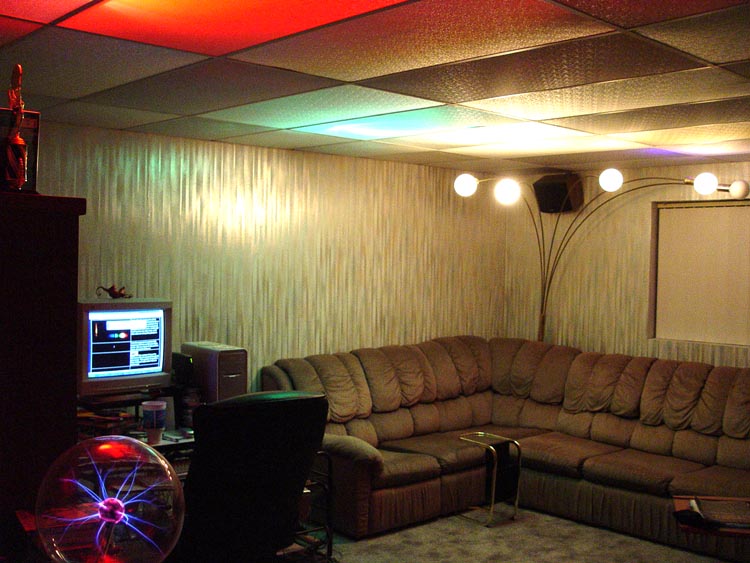
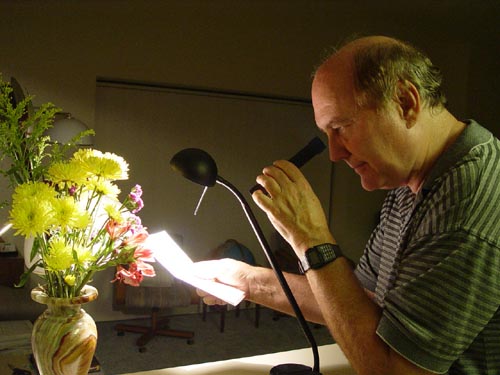
Our eyes see lights
but can't really tell what kind of light it is. For example, in the picture,
we aren't sure which rooms are lit by fluorescent lights or incandescent
lights (light bulbs). With a spectroscope we could. |
|
|
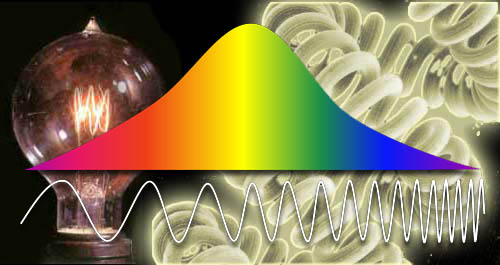
Light produced from objects that are hot
(like a filament) creates a spectrum of colors that is smooth and follows
a bell curve. At around 5,000 degrees Celsius an object looks white because
the spectrum centers around yellow with lesser
amounts of green, blue,
purple at smaller wavelengths, and lesser
amounts of orange and red
at longer wavelengths. |
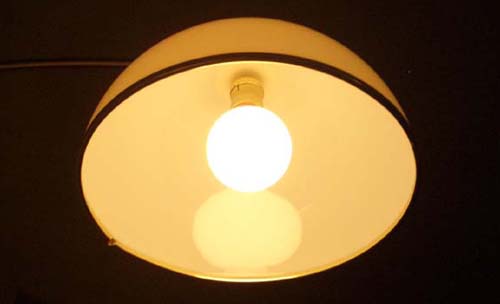 |
Here is an incandescent bulb that emits light from a hot
filament.
Below is a spectrum seen with the spectroscope. You can
see that the colors are continuous. |
|
The colors will look smeared together rather than banded. You may get a better spectrum by letting the light bounce off a white piece of paper. When viewing a light directly, the brightness is somewhat uneven. |
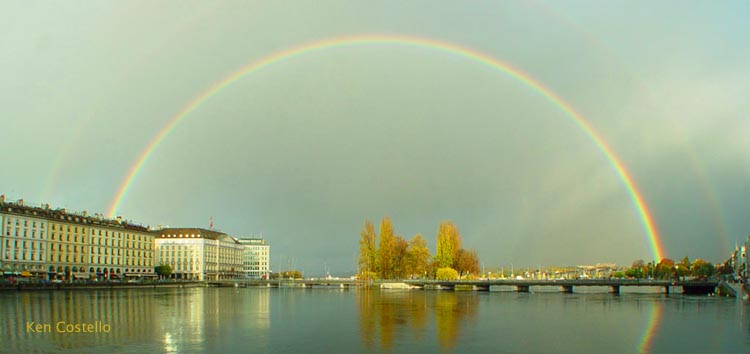
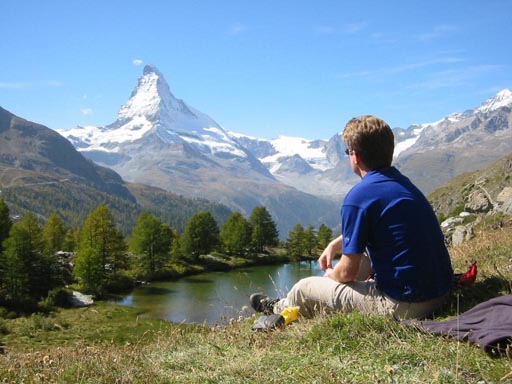
| Sunlight is in the same category as an incandescent bulb. The hot gases in the sun
produce a continuous spectrum of light as seen in this rainbow. |
|
|
|
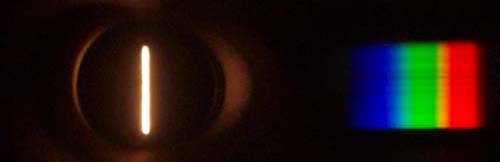
Here is what the spectroscope
sees with white objects lit by sunlight. Note: This is not aimed at the sun (which is not safe), but aimed at something white that is in the
sunshine or even in the shade. You see a continuous shade from red to purple.
It's basically the same as a rainbow. |
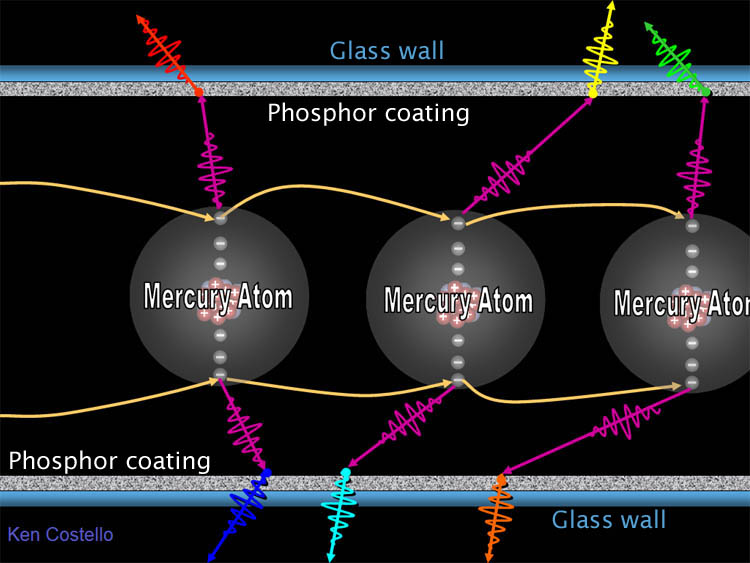
| Fluorescent lights however, produce light a
whole different way. In the below diagram we see mercury atoms. At high
voltage the outer electrons of mercury are stripped off. The will fall back
into a neighboring mercury atom. As they do, they give off a photon of ultraviolet
light (which we can't see). However, this UV
photon strikes the inside of the fluorescent bulb which is coated with various
phosphors. A phosphor is a mineral that absorbs
UV light and converts it to visible light.
Zinc sulfide (ZnS) doped with silver and aluminum emits blue
light. Many phosphors use exotic metals to create different colors. |
|
|
| The phosphors do not make a continuous range
of colors but emit colors at a few different regions of the spectrum. To get white light they must emit red, green (middle), and blue. This is enough to make
white. Some bulbs emit other colors in order to get a more complete spectrum of colors. |
|
|
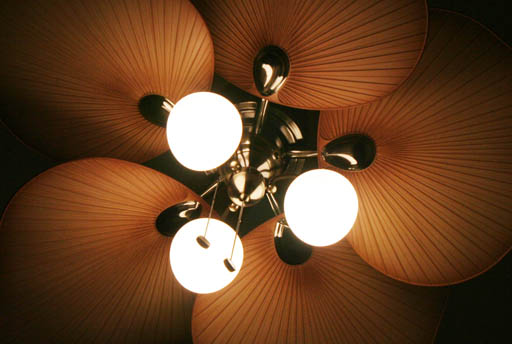
Here are some fluorescent lighting on my ceiling fan. It seems
white, but is it the same as the white from incandescent bulbs? |
|
|
No, through the spectroscope we see they aren't the same white. When fluorescent light passes through the spectroscope,
the white light is spread out so that we can see the separate bands of
colors. Here, it seems there are five different phosphors. For us to think we see white, colors from middle and both ends of the spectrum need to be present. Those are red, green or yellow (middle), and blue or purple. This is enough to give the appearance of white. Extra bands help fill in more colors. |
|
|
The spectroscope gives us insight into the makeup of the
light sources. We could use this feature to quickly identify
the type of lighting. For example, let's say we work at a company that
wants to save money by switching all lights
to the energy saving fluorescent type. You
can walk through the building and easily spot the incandescent
bulbs that haven't been changed. |
 |
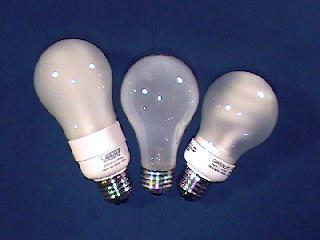
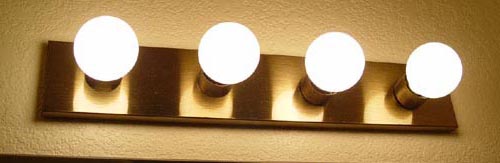
Here are two sets of globe-style
bulbs. Just by looking at them, we can't tell if they are the energy saving
type (fluorescent) or the incandescent type. But looking at them through
the spectroscope (from 2 to 10 feet away) we see a major difference. |
 |
The top spectrum goes with the top image above (4 bulbs).
The bottom spectrum goes with the bottom picture of 3 bulbs. (These spectrums are from the old spectroscope that didn't have a scale) You see the
continuous spectrum of incandescent bulbs (top) and the banded spectrum of the
energy-saver fluorescent bulbs (bottom). So we'd know quickly that the top 4 bulbs
need to be replaced.
These fluorescent round bulbs have a similar spectrum
as the long fluorescent bulbs. It shows two blue, one green, one orange
(faint), and one red band. |
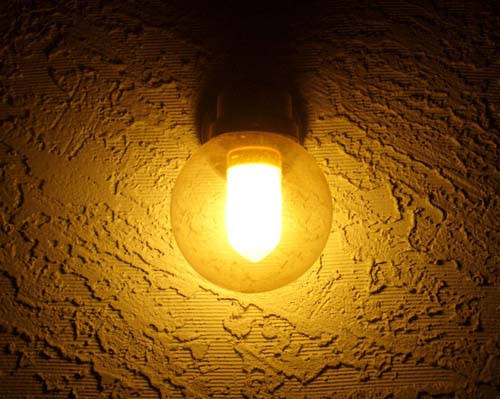 |
This is a long-life
bug light. Yellow color doesn't attract insects as much. |
|
|
Its
spectrum shows the signature of a fluorescent bulb. However, this one seems
to have a yellow band and a brighter red band, which would explain its yellowish
color. There's probably more of these phosphors (again this photo is of the older spectroscope that didn't have the wavelength scale) |
|
|
To the left is the spectrum of
a sodium lamp used for street lighting. Sodium metal heated produces a strong
yellow light. This spectrum shows a very bright (overexposed) yellow band.
Sodium normally only produces a yellow color, but under pressure extra bands of colors are produced. So street lamps are normally high pressure sodium lamps to give them more a white color. |
 |
Two winters ago, I went to Yellowstone. About
3 in the morning I woke up and decided to look outside. I saw this mysterious
glowing light in the distance, so I took a picture. It shimmered for a few
minutes and then faded away. At the lodge where I was staying, there were
no nearby towns or places that had light. I was afraid it was an outpost
that was on fire or a signal fire. I went to the front desk and showed the
image on my laptop to the security officer. He mounted his snowmobile and
went to investigate. If I had my spectroscope, I could have solved the mystery
on my own. The officer discovered that the glow was coming from some sodium
lamps outside some cabins about a 1/4 mile away. The low moving fog caused
the red glow to come and go. A spectroscope would have revealed the bands
of a sodium lamp. Light from flames would have been a continuous spread
of colors. |
| Your lab assignment is to examine light sources
in your home and the street lights by your house. Give me a report of what
you find. Again, don't point the spectroscope at the sun. |
|
|
 |
Notice, that I'm using a piece of white paper to
examine the light of this bright halogen lamp. Light bouncing off the paper
is better than looking into too bright of a light source. Again report what your spectrums (spectra) look like. This light is a halogen light. Halogen light have small bulbs and run very hot. They also produce UV light. Some bulbs have glass that blocks the UV light. Some do not. |
|
For this experiment, report which bulbs you looked at and what their spectra look like. Email your report
to chm107@chemistryland.com |
Experiment 2: Waste Heat from Blender (optional extra credit experiment) |
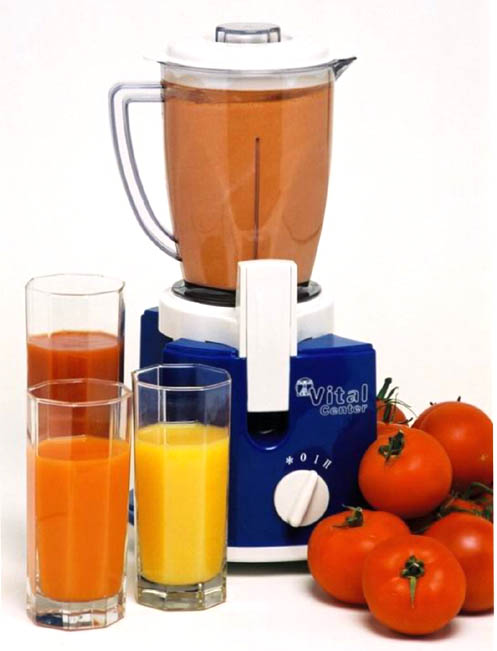 |
When people use a blender to blend items, they think the
electricity's energy is used to chop up, whip, or blend the contents of
the blender. Yes, some of this energy is used for that, but most ends
up as heat.
The blender is a good example of energy changing from
one form to another. Electrical energy comes into the blender, which turns
into magnetic energy in the electric motor. This magnetism repels permanent
magnets. The motor spins as well as the blade. So the magnetism is converted
to kinetic energy. As the blade hits the water, it gives some of its kinetic
energy to the water. The water starts to spin and mix, which means it
has kinetic energy. But much of water's movement is chaotic, meaning water
molecules are slammed into other water molecules. Water molecules are
always banging into each other, but this vigorous stirring is causing
them to pick up speed. This extra speed means it will have a higher temperature. |
 |
When the temperature of water is measured before mixing
and after mixing; and we know how much water is present, we can calculate
the amount of electrical energy converted to heat energy.
The lesson to be learned is that we use electricity for
all kind of chores. Unfortunately, most of that energy is not used for
the chore, but for creating heat that we didn't want. An electric heater
would be the only thing that uses all of the energy for what it is used
for. |
ITEMS NEEDED FOR LAB |
|
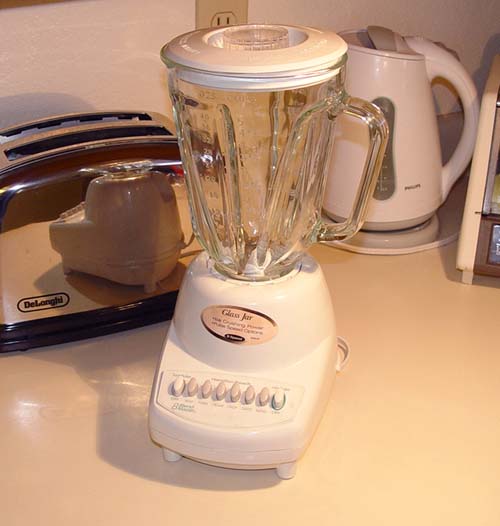
For this experiment you will need a blender. Since you are only putting water in the blender, a friend may let you borrow his or her blender. |
INSTRUCTIONS
FOR EXPERIMENT |
|
You will need to measure out 200 milliliters of tap water.
You might think you using the beaker with the mark saying "200 mL"
would be the way to do it. However, notice it says + or - 5%. 5% of 200
mL is 10 mL. That's a big error. Using the graduated cylinder, you can
measure at least to the closest 1 mL. So filling up the 100 mL graduated
cylinder twice is only 2 mL error, at most. |
|
Make sure your
blender is unplugged to begin with. |
|
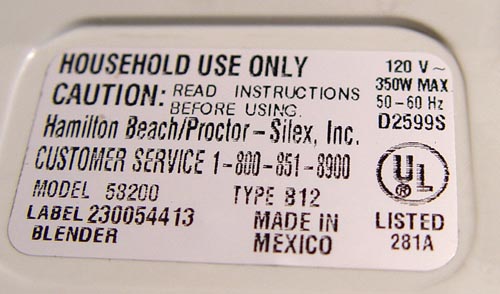
Look on bottom of blender and
see if you can find the watts that it uses. This one says 350W MAX. So it
uses 350 watts on maximum power. If you can imagine the heat from a 350
watt light bulb, you will get an idea of how much wasted heat could be created
by using this blender.
Some blender may not list the watts (W); however, they may list the amps. If that is the case, you multiply the amps by 120 volts and that gives you watts. |
|
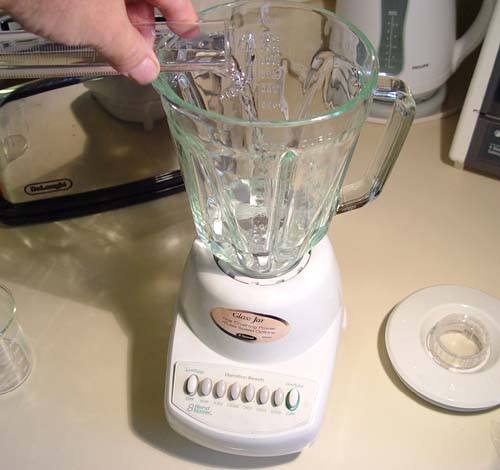
Fill graduated cylinder to 100 mL and
pour that into the blender. Fill the graduated cylinder again to 100 mL
and pour that also into the blender. You should have a total of 200 mL
in blender. |
|
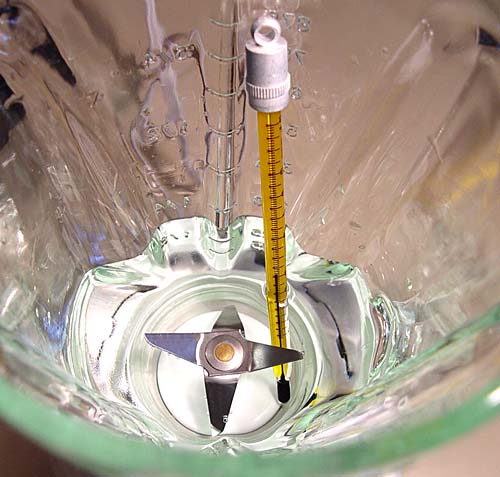
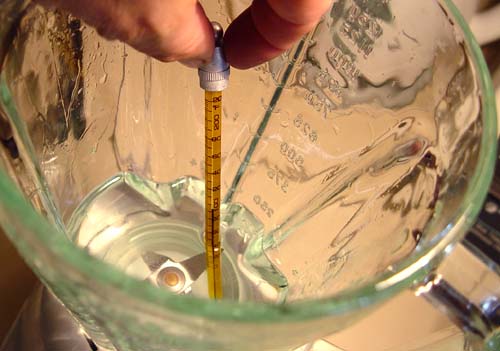
Place your thermometer into the blender (your thermometer looks different than the one shown). Wait about 3
minutes for the temperature of the water, blender, and thermometer to
reach the same temperature.
In other words, if the water was colder than the sides
of the blender, it will be warmed up by the blender and not by the electricity
used by the blender.
Take the thermometer out of the blender and read it. Write down the temperature of the water. My water was 22° Celsius. |
|
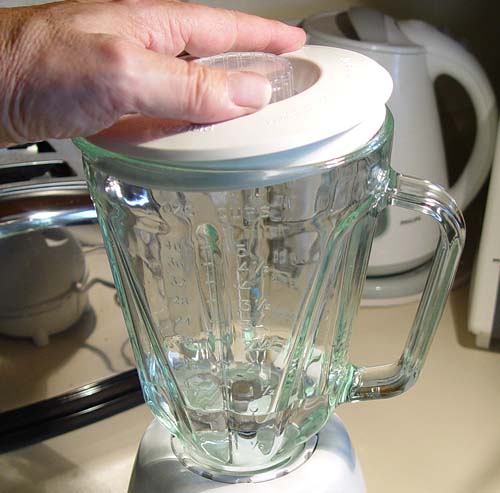
Put the lid
on the blender. Make sure the thermometer is NOT in the blender, but you
already knew that. |
|
Plug in the blender |
|
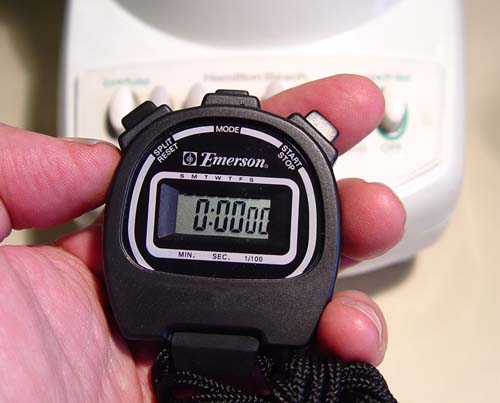
Use a stopwatch or any clock with a second hand to
time how long you keep the blender going. We want to go for 3 minutes.
If you go over, just record how much time you did keep the blender going.
|
|
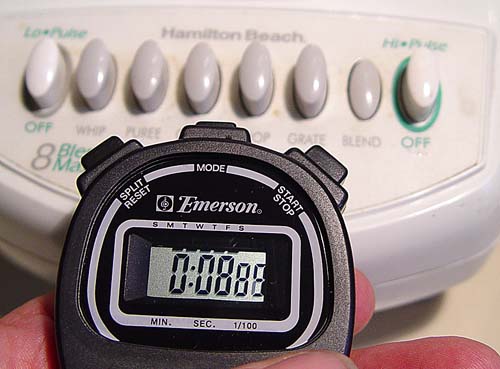
Here you can see I started my blender about 8 seconds
earlier and am using the setting called "blend." It seemed to
be the fastest setting on my blender. I'd recommend you use the fastest
setting unless you think it should go slower. |
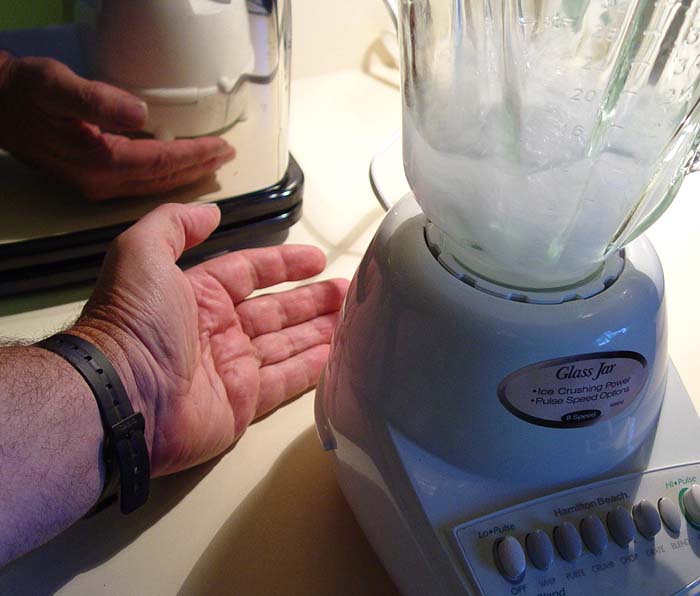
| While the blender is running, feel around the
base of the blender (see below) and see if you can feel air blowing out.
I felt air at the back of my blender. The air should feel warm especially at the end of the three minutes. |
|
|
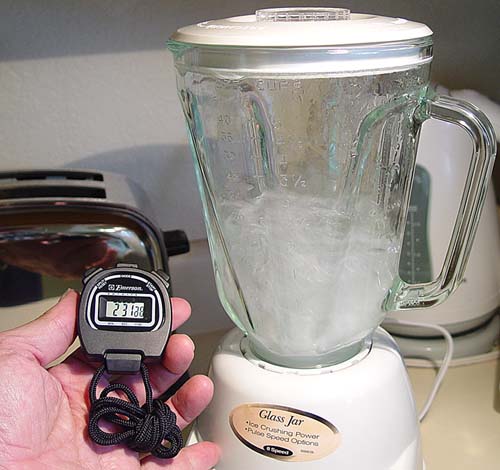
Here I am at
the two and half minute mark. At 3 minutes I turned the blender off. That
should be your target time as well. |
|
Unplug the blender again. |
|
Place the thermometer back into the blender in order to
get a final temperature. You might notice a little warmth as you lift
the lid off of the blender.
Wait about a minute for the thermometer to adjust to the
water's new temperature.
Take out the
thermometer and read it. My reading was 32 degrees Fahrenheit. |
Calories of energy is easy to calculate if we know the
milliliters of water and the degrees in Celsius that the water increased.
For me the temperature before the water was blended was 22°C and ended as 32°C after it was blended. So the rise was (32-22)= 10°C. Calculate the rise you had using your beginning and end temperatures..
A calorie is defined as the amount of energy to raise
one gram of water one degree Celsius. Since we know 1 mL of water weighs
1 gram, we know the 200 mL of water we used weighs 200 grams.
So we take the 200 grams times the 10 degrees C (in my
case) and we get 2,000 calories. Note that food "calories" is
actually 1,000 of these kind of calories.
We remember that my blender puts out 350 watts. One watt
is about 1/4 of a calorie per second. So 350 watts is about 88 (350/4)
calories per second. Three minutes is 180 seconds. So the total calorie
output of the motor was 180 sec x 88 cal per sec = 15,840 calories.
However, the water only shows that it absorbed 2,000 calories. So that means there was 13,840 calories (15,840-2000) unaccounted for. So where did the other 13,840 calories go? Those calories were lost as heat from the motor. More specifically, the energy (calories) were lost due to friction of electrons passing through the hundreds of feet of small copper wire in the motor that creates the magnetism to spin the motor.
|
Assignment (use my calculations above as a guideline):
1) Report your starting and ending water temperatures
in Celsius.
3) Calculate and report how many calories your water absorbed.
4) Report the wattage of your blender.
5) Report the total calories your blender used in three
minutes.
6) Subtract the calories your water absorbed from the total calories. That is the amount of calories lost to heat from motor. Report your answer.
Send report to Ken Costello at chm107@chemistryland.com
|